

Wholesale squeeze bottle cost is most useful when it is calculated per usable bottle, not per bottle ordered. The numerator includes every cost required to approve, produce, move, receive and hold the package. The denominator includes only bottles that arrive fit for filling or resale.
The working formula is: true cost per usable bottle = total program cost divided by sellable bottles received. For planning, sellable bottles received can be estimated as order quantity multiplied by expected usable yield. The model exposes a common purchasing blind spot: a low factory price can lose its advantage when the quote excludes closures, consumes too much container space or produces more rejected packages.
This guide is a calculation framework rather than another supplier-sourcing checklist. It separates quoted price, landed inventory cost and operating risk so finance, procurement, packaging and quality teams can compare the same scope before approving a wholesale order.
- Quoted unit price measures the component at the supplier's stated scope.
- Landed cost measures the inventory delivered to the agreed destination.
- Cost per usable bottle adjusts the total for rejects, transit damage and unusable closures.
- Full TCO adds the costs created during storage, filling, dispensing, complaints and replenishment.
Unit price, landed cost and TCO are different numbers
Unit price is the smallest number in the model. It may describe an empty bottle body only, a bottle-and-cap set, or a decorated and packed set. Until the scope is normalized, two unit prices may describe different products.
Landed cost adds the expense of getting the approved package to the named destination. Freight responsibility depends on the agreed trade term. The ICC Incoterms 2020 rules allocate defined costs, risks and obligations between seller and buyer, but the quotation still needs a named place and a precise component scope.
TCO extends beyond customs release. It recognizes that warehouse space, tied-up cash, filling-line rejects, leakage, damaged labels, emergency replacement orders and customer claims also consume margin. These downstream items belong in scenario planning even when they do not appear on the commercial invoice.
| Cost View | Included Scope | Best Use | What It Can Miss |
|---|---|---|---|
| Quoted unit price | The components and packing labor explicitly listed in the quote | Initial supplier screening | Caps, liners, decoration, cartons or setup charges |
| Extended factory cost | Bottle set, decoration, setup, tooling allocation, export carton and factory-side inspection | Like-for-like quotation comparison | International freight, duty and destination charges |
| Landed cost | Extended factory cost plus transport, insurance, duty, customs and delivery to the named point | Inventory valuation and import budgeting | Defects, storage, line losses and complaint recovery |
| Cost per usable bottle | Landed cost divided by approved units available for filling or sale | Quality-adjusted supplier comparison | Longer-term inventory and service consequences |
| Total cost of ownership | Usable-unit cost plus carrying, operational, shortage and failure costs over the buying cycle | Final sourcing and reorder decisions | Only as accurate as the assumptions and tracking data |
Build a finance-ready wholesale squeeze bottle cost formula
A useful model keeps each cost visible instead of hiding everything inside one delivered number. Total program cost can be expressed as: product set + customization + tooling allocation + inspection + export packing + international freight + insurance + duty and tax + customs and port charges + inland delivery + warehouse carrying cost + expected failure and recovery cost.
The denominator is equally important. Estimated usable units = order quantity multiplied by expected usable yield. When 50,000 pieces are ordered and the expected combined rejection and damage rate is 2 percent, the planning denominator is 49,000 pieces, not 50,000.
True cost per usable bottle = total program cost divided by usable units. Keeping the loss rate outside the numerator prevents a common spreadsheet error: adding the value of expected defects as a cost while still dividing by every unit ordered.
| Formula Input | Recommended Unit | Evidence Source | Sensitivity Driver |
|---|---|---|---|
| Bottle, cap, valve and liner | Currency per complete set | Supplier quote and approved bill of materials | Material, gram weight, closure design and quantity |
| Decoration and setup | Total plus cost per set | Artwork quotation and setup sheet | Colors, print process, label stock and SKU count |
| Tooling allocation | Total tooling divided by forecast approved units | Tooling quote and commercial-life forecast | New mold scope, expected volume and design changes |
| Freight and destination charges | Total shipment cost | Forwarder and broker quotations | CBM, route, season, pallet method and trade term |
| Usable yield | Percent of units fit for use | Incoming QC, filling rejects and claim history | Cap fit, molding consistency, packing and handling |
| Inventory carrying cost | Average inventory value times carrying rate | Finance and warehouse data | MOQ, demand variability and replenishment lead time |
Normalize every quotation before comparing suppliers
The comparison starts with one approved specification. Bottle capacity, resin, bottle weight, neck finish, closure, valve or liner, color, decoration, carton quantity, pallet rule and food-contact document scope need to match across quotes. A bottle-only EXW quote cannot be compared directly with an FOB bottle-and-cap set.
Packing assumptions deserve their own line. Some programs ship caps assembled; others pack caps separately to protect nozzle tips or improve bottle count. Individual OPP bags, dividers, stronger cartons and pallets add cost and may save more by preventing scuffing, deformation or receiving labor.
Commercial teams can then tag every figure as confirmed, quoted, estimated or excluded. This simple status prevents a provisional duty rate or unconfirmed carton size from appearing as a final cost.
| Normalization Field | Quote A | Quote B | Comparison Rule |
|---|---|---|---|
| Component scope | Bottle body only | Bottle, cap and liner | Add the missing closure set before comparing price |
| Trade term | EXW factory | FOB named port | Move both quotes to the same named delivery point |
| Decoration | Label excluded | One-color printing included | Price the approved artwork route for both |
| Packing | Loose bag and carton | Individual bags and dividers | Compare protection level, carton count and receiving work |
| Quality basis | Visual check only | Approved sample plus pre-shipment inspection | Apply a realistic usable-yield assumption to each route |
| MOQ and forecast | 5,000 pieces | 20,000 pieces | Include inventory months and cash exposure, not only price breaks |
Freight follows cube as well as weight
Empty plastic containers are light and voluminous. Ocean freight is commonly planned by container space, while parcel and air routes may use dimensional weight. Bottle geometry, carton dimensions and cap-packing method can therefore change freight per piece without changing the resin weight.
The useful carton calculation is: shipment CBM = carton length multiplied by width multiplied by height multiplied by carton count. Freight per usable bottle = allocated freight and destination transport divided by usable units. The model works only when the carton dimensions come from the proposed production pack, not a rough catalog estimate.
Bulk Condiment Squeeze Bottles can reduce handling frequency, but larger diameters may lower carton density. A slimmer bottle may load efficiently yet need stronger wall distribution or cap protection. Packing optimization is therefore a balance among cube, damage rate, production handling and presentation.
| Packing Variable | Potential Saving | Possible Cost Transfer | Validation Point |
|---|---|---|---|
| Caps packed separately | More bottle bodies may fit per carton | Extra receiving or assembly labor | Count labor and cap damage at destination |
| Bottles packed with caps fitted | Faster line-side receiving | Lower carton density or exposed nozzle tips | Check compression, scuffing and cap alignment |
| No pallet | Higher container utilization | More manual handling and carton damage exposure | Confirm warehouse unloading and carton-strength requirements |
| Palletized shipment | Faster handling and cleaner unit loads | Pallet volume and weight reduce bottle count | Use the destination warehouse's accepted pallet footprint |
| Individual protective bag | Reduces abrasion on clear or printed surfaces | Film, labor and added packing volume | Compare scuff rejects with and without protection |
Defect rate changes the denominator
A defect rate does more than reduce inventory. If a leak is discovered after filling, the loss can include the container, cap, sauce, label, filling labor, carton cleanup and replacement freight. The same physical defect therefore has a very different cost depending on where it is detected.
Incoming inspection and pre-shipment checks protect different parts of the model. Pre-shipment review can screen mouth flatness, thread engagement, flash, deformation, appearance, cap fit and packing before freight is committed. Incoming inspection confirms that the shipment still matches the approved sample after transport.
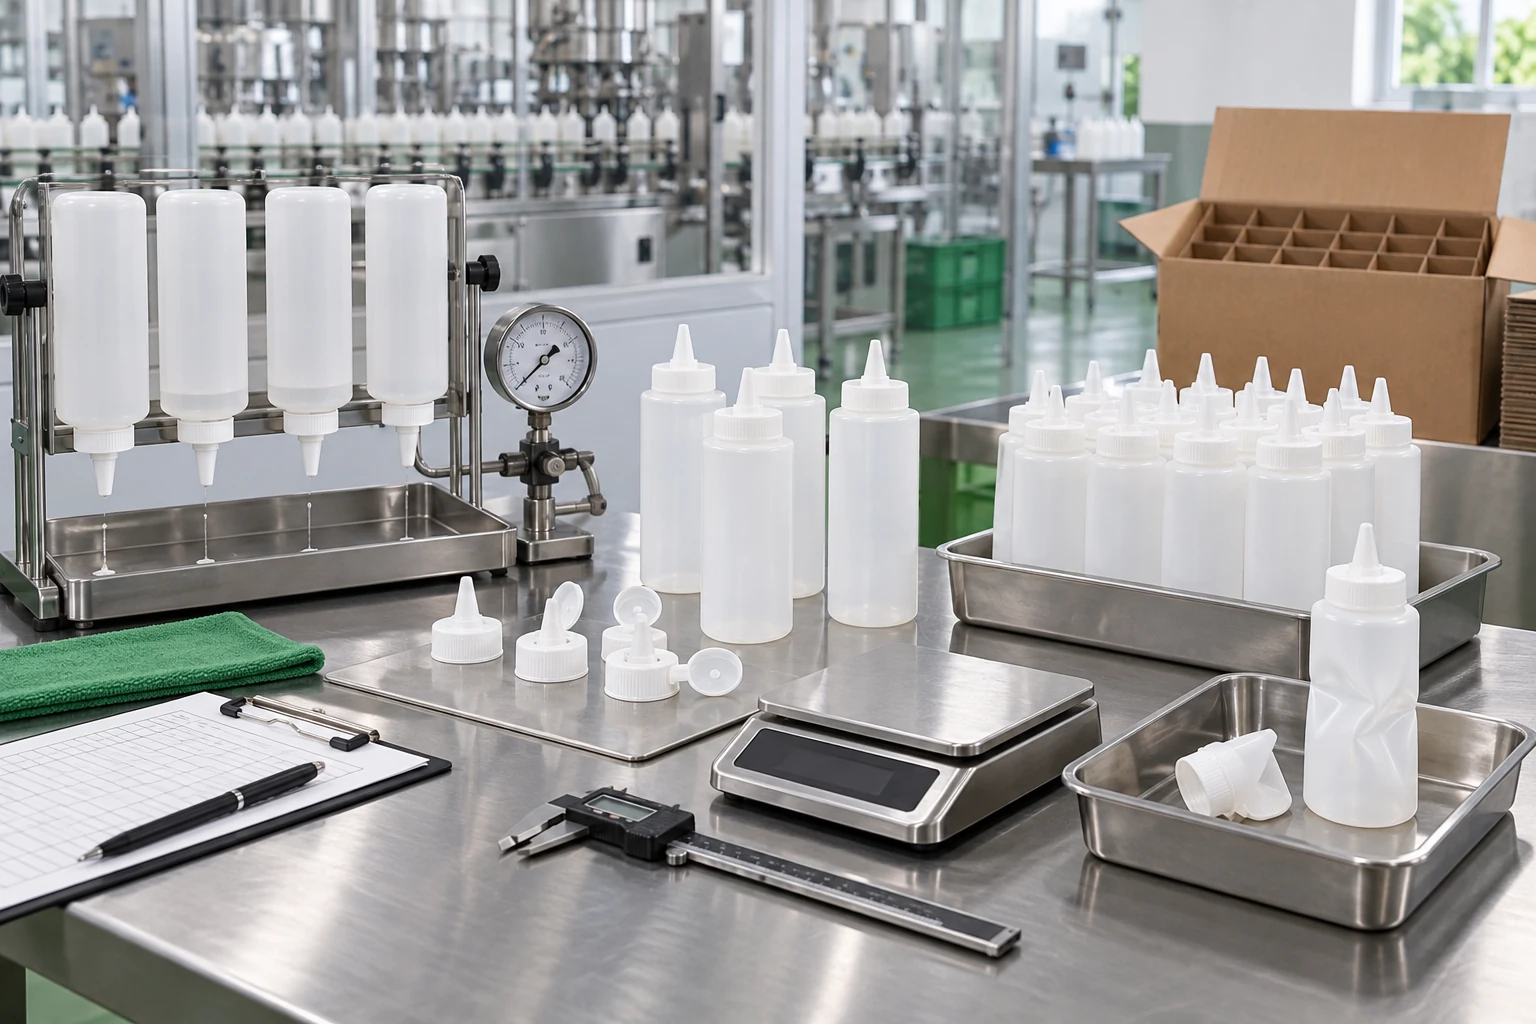
Quality-adjusted costing keeps accepted units in the denominator and records recovery cost separately. For example, a $35,000 shipment with 49,500 usable pieces costs about $0.707 per usable bottle. At 48,000 usable pieces, the same shipment costs about $0.729 before any filling loss or complaint cost is added.
- Bottle and neck defects can create capping or filling-line rejects.
- Closure mismatch can create leakage during inversion, vibration or temperature change.
- Surface scuffing and label damage can turn structurally sound bottles into unsellable retail inventory.
- Weak cartons can create a cluster loss rather than one isolated reject.
Tooling and decoration need an amortization rule
A new mold is an investment rather than a normal per-order consumable. Tooling allocation per bottle can be calculated as tooling and development cost divided by the approved units expected over the design's realistic commercial life. A forecast of one million units produces a very different answer from a one-season launch of 20,000 units.

Existing molds can remove or reduce bottle-tooling exposure when the capacity, neck finish, label panel and dispensing behavior already fit. Custom Sauce Bottles still carry other setup costs, including color matching, printing screens, fixtures, label tooling, shrink-sleeve cylinders or trial runs depending on the decoration route.
Decoration setup can be allocated by SKU and reorder life instead of being buried in the first-order unit price. This keeps a one-color repeat program comparable with a short promotional design that requires multiple artworks and changeovers.
Inventory, cash and reorder risk complete the model
MOQ affects more than the price break. It determines how many months of inventory enter the warehouse, how much cash is committed before use and how much exposure remains if artwork, formula or demand changes. A lower price at four times the required inventory can carry a higher financial cost.
A simple carrying-cost estimate is average inventory value multiplied by the organization's annual carrying rate and the fraction of the year held. Finance teams may include capital cost, storage, insurance, handling, obsolescence and shrinkage in that rate. The same definition needs to be used for every sourcing route.
Reorder risk works in the opposite direction. Ordering too little can trigger expedited freight, emergency local purchases or filling-line downtime. A practical model compares base demand, forecast variance, supplier production time, ocean transit, customs allowance and safety stock instead of treating MOQ as an isolated negotiation point.
| Inventory Decision | Visible Benefit | Hidden Exposure | TCO Measure |
|---|---|---|---|
| Large MOQ for price break | Lower quoted cost per piece | More cash, storage and obsolescence | Cost per usable bottle plus carrying cost |
| Small frequent orders | Lower average stock | Higher freight frequency and shortage exposure | Annual transport cost and service level |
| Custom color inventory | Stronger brand control | Leftover bottles cannot easily move to another SKU | Forecast error and write-off allowance |
| Shared bottle family | Fewer components and simpler replenishment | Less distinctive structure | Inventory pooling benefit across SKUs |
| Safety stock | Protects filling continuity | Capital and warehouse space | Expected shortage cost versus carrying cost |
Worked example: the cheaper quote nearly disappears
The following 50,000-piece comparison is illustrative, not a market price guide. Both scenarios are normalized to a complete bottle-and-cap set delivered to the receiving warehouse. The purpose is to show how the denominator and excluded costs change the result.
Supplier B begins with an advertised unit price about 46 percent below Supplier A. After freight, duty, brokerage, inspection, setup and storage are included, Supplier B remains only about 2 percent lower per usable bottle. A small change in freight or yield can reverse the decision, which is why the visible factory price is not a sufficient approval metric.
| Cost Component | Supplier A: Regional Stock | Supplier B: Overseas Factory |
|---|---|---|
| Quoted unit price | $0.65 | $0.35 |
| 50,000 complete sets | $32,500 | $17,500 |
| International and inland freight | $4,500 | $12,000 |
| Duty, customs and brokerage | $0 | $3,750 |
| Inspection and qualification | $500 | $650 |
| Decoration or setup allocation | $0 | $1,000 |
| Estimated warehouse carrying cost | $1,200 | $1,800 |
| Total modeled cost | $38,700 | $36,700 |
| Expected usable yield | 99% / 49,500 units | 96% / 48,000 units |
| True cost per usable bottle | $0.782 | $0.765 |
Where direct manufacturing control can reduce TCO
The factory's useful role is to reduce uncertainty in the variables it can control. Gracepack's existing platform includes more than 500 owned molds and over 5,000 standard bottle types, allowing an existing shape to be evaluated before new tooling is added to the model. Standard project discussions often begin around 5,000 pieces, while the practical MOQ depends on the bottle, cap, color, decoration, stock and packing route.
Bottle bodies, Condiment Caps and Closures, labels, printing and export packing can be reviewed as one component system. The production base includes nine automatic lines, 15 injection molding machines, 13 blow molding machines, three labeling machines and five printing machines. These capabilities matter to TCO only when they improve cap matching, reduce handoffs, shorten sample loops or keep repeat specifications consistent.
Pre-shipment review can cover appearance, bottle mouth, thread smoothness, flash, deformation, cap fit and packing. Food-contact document support is matched after PET, PP, PE, LDPE, HDPE or silicone components are confirmed. For foodservice sauce containers, sample approval can also include squeeze feel, output, cap cleaning access and carton handling before the purchase order moves into mass production.
- Use an existing mold when it meets the functional and commercial brief.
- Approve the bottle, cap, liner or valve as one working package.
- Confirm carton dimensions and cap-packing method before freight comparison.
- Match inspection points to the failures that would create the largest downstream cost.
- Preserve sample, color, drawing and packing references for repeat orders.
TCO input checklist for a comparable quotation
A costed sample review becomes more accurate when commercial and technical inputs arrive together. The list below gives procurement, finance and packaging teams a common starting sheet without turning the article into a general supplier-selection guide.
- Complete component scope: body, cap, nozzle, valve, liner, seal and packing labor.
- Product behavior: viscosity, particles, oil or acid content, fill temperature and storage orientation.
- Commercial scope: first order, annual forecast, SKU count, target inventory months and launch date.
- Customization: resin or cap color, label, silk screen, sleeve, hot stamping, carton mark and tooling.
- Packing: pieces per carton, carton dimensions, gross weight, caps assembled or separate, pallet requirement and dividers.
- Logistics: named Incoterm place, freight mode, destination port, brokerage, duty assumption and final delivery point.
- Quality: approved sample, inspection method, expected usable yield, replacement route and claim evidence.
- Compliance: destination market and food-contact documentation required for the final component materials.
FAQ
How is wholesale squeeze bottle cost calculated?
Add the complete package, customization, allocated tooling, inspection, packing, freight, duties, destination charges, carrying cost and expected recovery cost, then divide by the number of bottles expected to arrive usable.
What is the difference between landed cost and TCO?
Landed cost normally ends when inventory reaches the named destination. TCO adds storage, tied-up cash, filling losses, defects, complaints, shortages and other costs created during the buying and use cycle.
How should defect rate be included?
Forecast usable units as order quantity multiplied by expected usable yield. Keep post-detection recovery costs, such as rework or replacement freight, as separate numerator items so the same loss is not counted twice.
Does an existing mold always produce the lowest cost?
Not always. It usually reduces tooling and development exposure, but a new mold can be justified when it materially improves filling, carton density, dispensing, brand value or long-term volume economics.
Why do empty squeeze bottles create high freight cost?
They occupy substantial carton and container space relative to their weight. Bottle geometry, cap packing, cartons, dividers and pallets can therefore influence freight per piece more than small changes in resin weight.
What information is needed for a TCO-based quote?
The minimum useful input includes the complete component set, capacity, resin, cap, decoration, order quantity, annual forecast, carton assumptions, named delivery point, target market and expected quality checks.
Turn the quotation into a usable-unit decision
A wholesale bottle decision becomes defensible when every supplier is measured against the same component scope, destination, packing method and usable-yield assumption. Unit price remains important, but it becomes one input rather than the answer.
Gracepack can prepare a costed sample route for standard and custom squeeze bottle programs. Share the required capacity, product behavior, closure, decoration, first order quantity, annual forecast, destination and current carton or defect concern. The response can compare an existing-mold route, customization costs, packing assumptions and the information needed to calculate cost per usable bottle before bulk production.


